Dashboard
A COVID data explorer grew into a personal dashboard and a collection of everyday web tools. A long-running React project where I learned to connect interfaces, interactive charts and real data.
- Role
- React developmentData visualisation · API integrations
- Year
- 2020
- Type
- Personal project
- Service
- User interface development
- Website
- dsgnbyhl.comOpens in a new tab


Learning React by building a working app
I started Dashboard in 2020, at the beginning of COVID. I wanted to build something interactive, and pandemic data gave me a concrete starting point. The first version combined COVID statistics with a few stock and cryptocurrency widgets.
I spent hundreds of hours on the project. Each new view raised a practical question: how do I share state, load data and make a chart respond to a selection? I learned React by developing the pieces of one application over time.
One selection connects several views
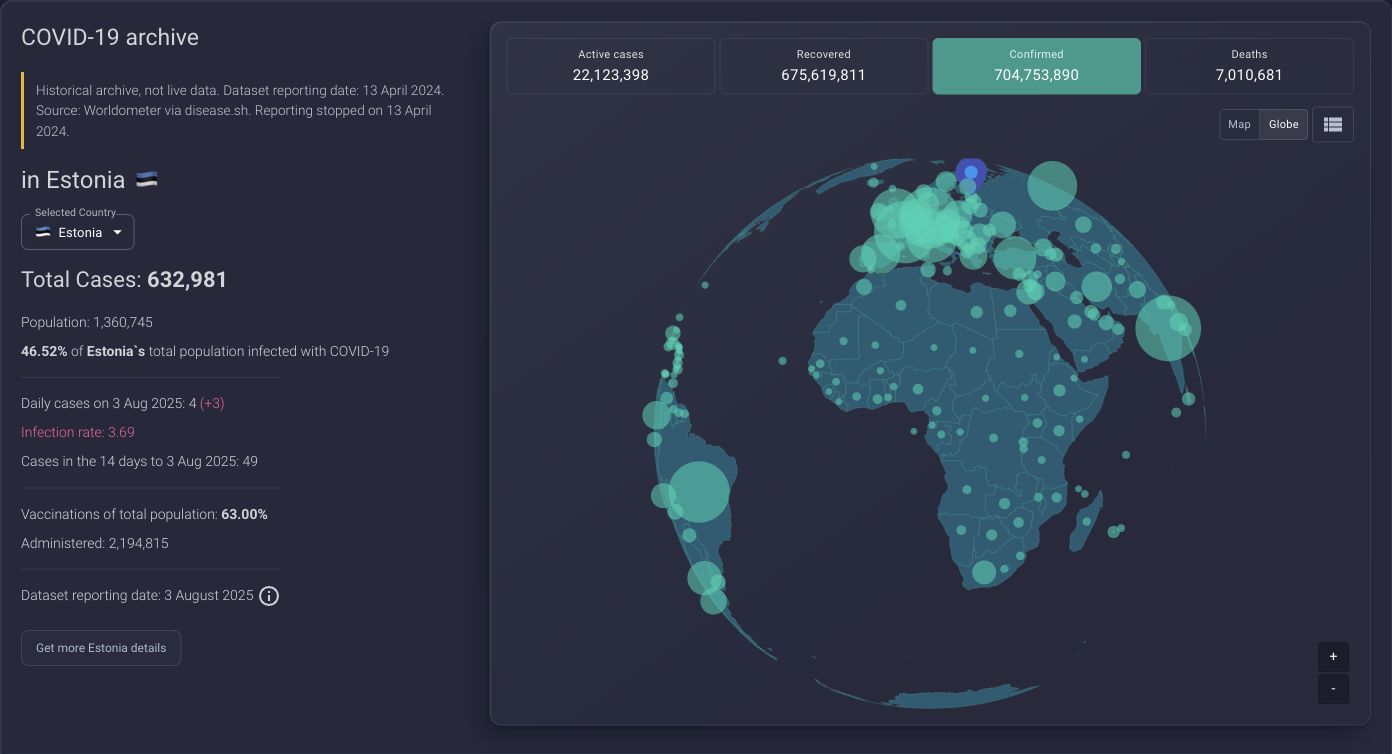
In the COVID explorer, selecting a country connects the summary, map and timeline. Visitors can switch between a flat map and a globe, change the metric and open a country detail page. The Estonia view adds hospitalisation trends and age and gender breakdowns.
This was the project’s first substantial interaction: one choice had to reach several components. Today, the COVID section is a historical archive. Its sources cover different reporting periods, so the charts need to be read alongside their source and date.
The work behind the charts
I learned the most where components, data and user actions had to work together.
Shared state
React state connects selections to amCharts and Chart.js. Opening a view creates its charts; changing data updates them; closing the view releases their resources.
Asynchronous data
Changing country cancels the previous request so a late response cannot overwrite the new selection. Timelines align by date, and missing observations stay distinct from zero.
A growing application
Next.js gives views their own addresses. Larger views load separately, while a Node.js and Express API brings together some data sources. Newer provider adapters cache data and flag stale responses.
From data to everyday tools
The dashboard gradually gained tasks, a focus timer and notes, alongside weather, electricity prices and Tallinn transport. Widgets can be hidden, restored and reordered within their groups.
It now has a separate tool collection: calculators, PDF merging, image resizing, text comparison and QR codes. Search and task categories help visitors find a tool, and each has its own address that opens without an account.
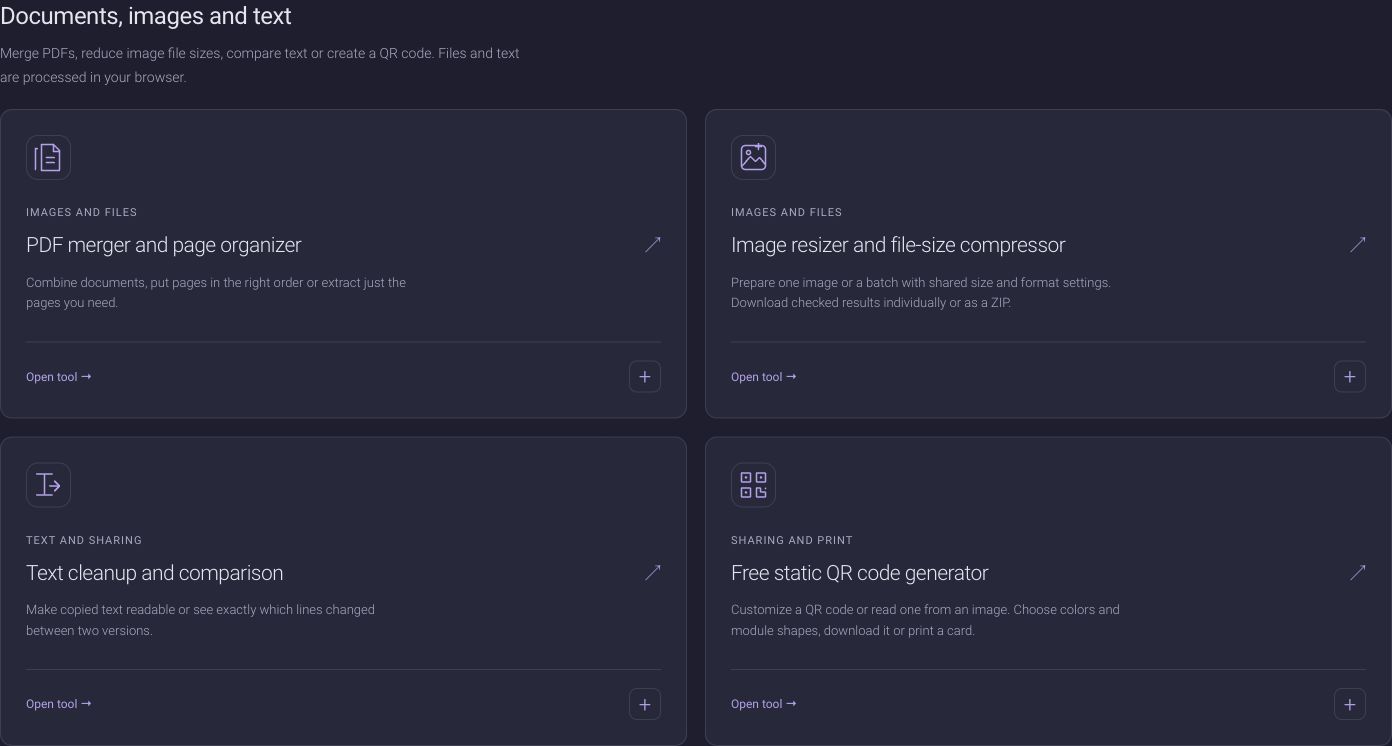
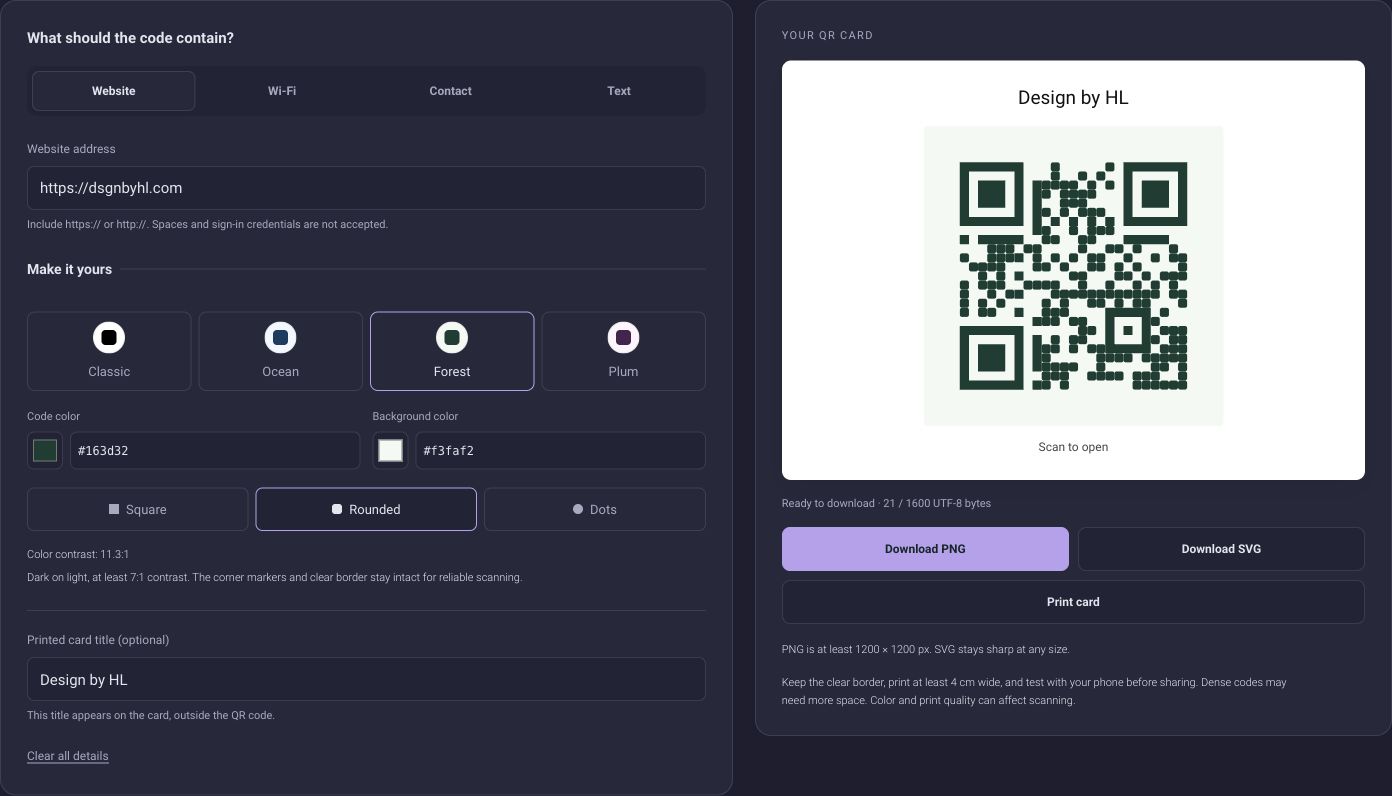
Screenshots from the public English application, 23 October 2026. Select an image to open a larger view.
What I took from the project
Dashboard gave me a practical understanding of React: keeping views connected, handling slow data sources and developing the same application over several years. It remains a place where I can try new ideas in a working product.
I also learned to make the limits clear. Tasks and notes stay in the browser, with a downloadable backup for moving them to another device. PDF, image and text tools process content in the browser. Fresh external data still needs a connection.
Other projects
All projects
